আরও দেখুন

 20.12.2023 08:38 AM
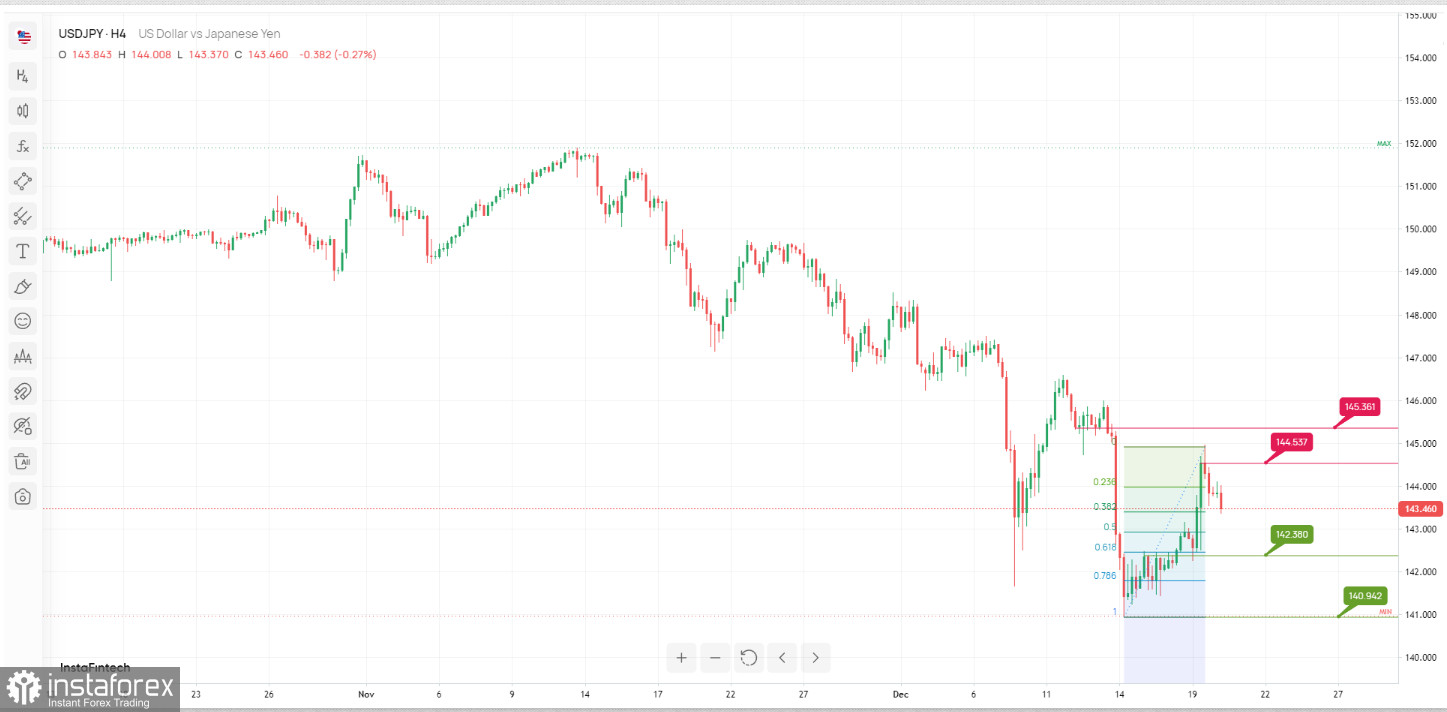
The USD/JPY chart is currently indicating potential signs of a bearish momentum, as it approaches a key support level and could potentially reverse off this support.
Resistance Levels:
The 1st resistance at 144.53 is categorized as a "Pullback Resistance" indicating its potential to hinder upward price movements. Beyond this, the 2nd resistance level at 145.36 is also identified as "Pullback Resistance" emphasizing its role as a substantial barrier to further advances.
Support Levels:
On the support side, the 1st support at 142.38 is recognized as an "Overlap Support". This level suggests a zone where buying interest may emerge, potentially providing some support to the price. Additionally, the 2nd support at 140.94 is characterized by a "Swing-low Support", reinforcing its significance as a substantial support zone.
You have already liked this post today
*এখানে পোস্ট করা মার্কেট বিশ্লেষণ আপনার সচেতনতা বৃদ্ধির জন্য প্রদান করা হয়, ট্রেড করার নির্দেশনা প্রদানের জন্য প্রদান করা হয় না।


