আরও দেখুন

 09.04.2026 01:05 PM
Trade Review and Tips for Trading the Japanese Yen
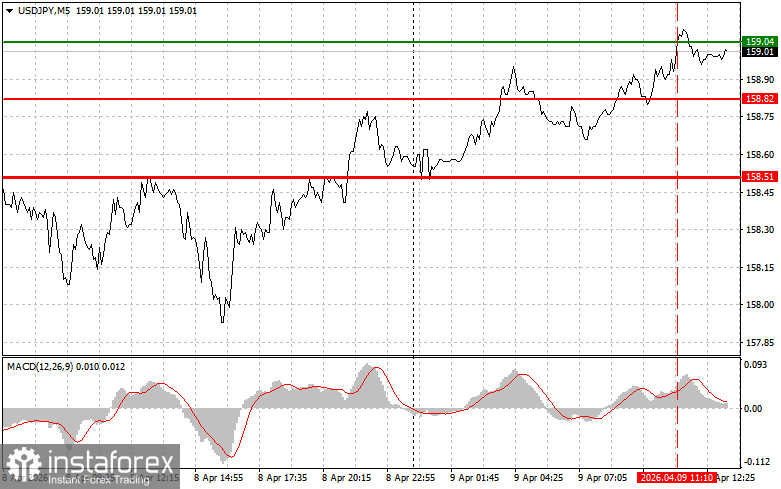
The test of the 159.04 price level occurred when the MACD indicator had already moved significantly above the zero line, limiting the pair's upward potential. For this reason, I did not buy the dollar.
Important U.S. macroeconomic data will be released shortly, helping to assess the current state and development of the American economy. Special attention should be paid to the change in U.S. GDP for Q4 2025. These quarterly data provide a broader perspective on economic growth. Recall that after a 4.4% rise in Q3, U.S. GDP grew only 0.7% in Q4. Today, the final estimate of growth will be published. Positive GDP dynamics indicate rising economic activity, increased production and consumption, which signals a healthy and growing economy. Good GDP data will support dollar strength against the yen.
Separate attention will be given to the U.S. Core Personal Consumption Expenditures (PCE) indicator. PCE data, especially the Core PCE component excluding volatile food and energy prices, play a key role in shaping Federal Reserve monetary policy. Taken together, these indicators provide a comprehensive picture of the U.S. economy.
For intraday trading, I will primarily rely on Scenarios No. 1 and No. 2.
Buy Signal
Scenario No. 1: I plan to buy USD/JPY today upon reaching the entry level around 159.07 (green line on the chart) with a target of 159.49 (thicker green line). Around 159.49, I will exit long positions and open sales in the opposite direction (expecting a 30–35 point move). Dollar gains are likely if U.S. data is strong.Important: Before buying, ensure the MACD indicator is above zero and just starting to rise from it.
Scenario No. 2: I also plan to buy USD/JPY if there are two consecutive tests of 158.88 while the MACD indicator is in the oversold area. This will limit downward potential and trigger a reversal upward. Expected targets are 159.07 and 159.49.
Sell Signal
Scenario No. 1: I plan to sell USD/JPY after a breach of 158.88 (red line on the chart), which should lead to a quick decline. The key target for sellers is 158.51, where I will exit sales and immediately open buys in the opposite direction (expecting a 20–25 point move). Pressure on the pair may return at any moment.Important: Before selling, ensure the MACD indicator is below zero and just starting to decline from it.
Scenario No. 2: I also plan to sell USD/JPY if there are two consecutive tests of 159.07 while the MACD indicator is in the overbought area. This will limit upward potential and trigger a reversal downward. Expected targets are 158.88 and 158.51.
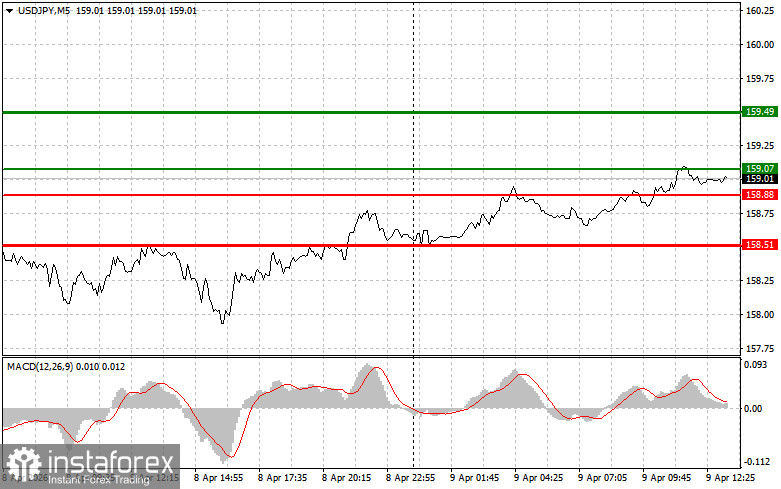
Chart Notes
Important: Beginner Forex traders should exercise extreme caution when entering the market. It is best to stay out before major fundamental reports to avoid sudden price swings. If you decide to trade during news releases, always use stop-loss orders to minimize losses. Without stop-losses, you can quickly lose your entire deposit—especially if you do not use proper money management and trade large volumes.
Remember, successful trading requires a clear trading plan like the one outlined above. Making spontaneous decisions based on current market conditions is a losing strategy for intraday traders.


