یہ بھی دیکھیں

 13.03.2026 04:22 AM
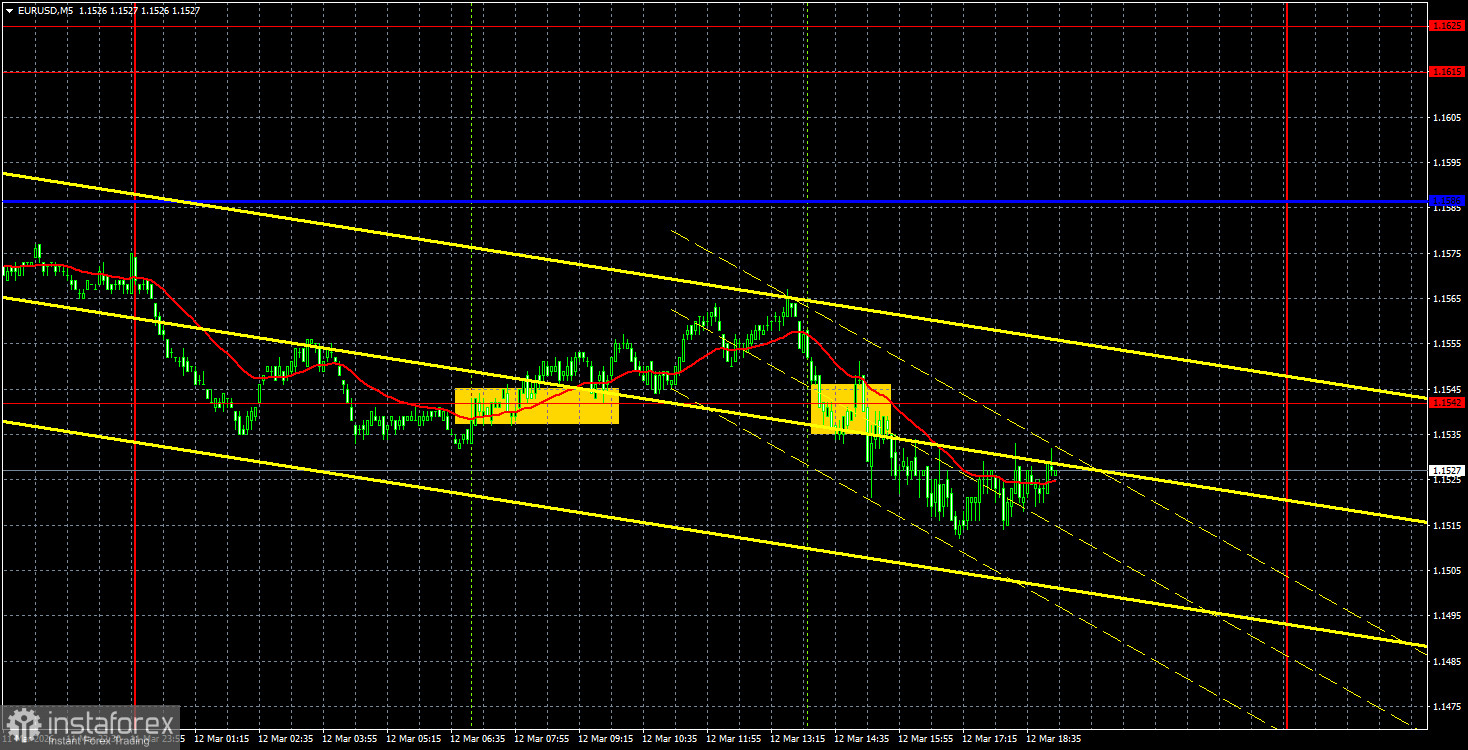
The EUR/USD currency pair failed to maintain its upward momentum on Wednesday, with sentiment declining entirely due to geopolitical factors. Unfortunately, we find ourselves discussing geopolitics rather than economics, as economic reports and events have little impact on the dollar or the pound exchange rates. As mentioned earlier, by mid-week, the geopolitical backdrop deteriorated again, and markets recognized that there would be no talk of an end to the conflict in the Middle East anytime soon. Trump may call for the conflict to end, but that doesn't mean a peace agreement has been reached with Iran, that the Strait of Hormuz will be unblocked, or that Tehran will stop striking U.S. bases and all allies in the region. By the way, just last night, Iran attacked vessels in the UAE, damaging them, not only military or industrial targets. Consequently, demand for the safe-haven U.S. dollar has increased once again amid a lack of positive developments in the Middle East.
From a technical perspective, the downward trend has not yet turned into an upward one. The Senkou Span B line has not been breached, and the area around 1.1657-1.1666 did not allow the euro to push higher. If geopolitical tensions remain as severe, the dollar could continue to rise, contradicting the technical, fundamental, and macroeconomic outlook. In other words, geopolitics is currently paramount.
On the 5-minute timeframe, several trading signals were generated yesterday. During the U.S. trading session, the inflation report was released, only to confuse traders. While inflation remained unchanged, the dollar temporarily dipped across the board before returning to its upward trajectory. Consequently, of the four trading signals, only three provided profit opportunities, making it difficult to capitalize on movements throughout the day.

The latest COT report is dated March 3. The illustration on the weekly timeframe shows that the net position of non-commercial traders remains "bullish," and since Trump took office for a second time, the dollar has only been falling. We cannot definitively state that the decline of the U.S. currency will continue with 100% certainty, but current developments suggest this is a possibility.
We still see no fundamental factors that would strengthen the European currency, even amid the war in the Middle East. However, there are plenty of factors supporting the decline of the American dollar. The global downward trend still holds, but how significant is it now, given that the price has moved over the last 18 years? Since September 2022, a new upward trend has formed, breaking through the global descending trend line. Thus, the path further upward is open.
The positioning of the red and blue lines of the indicator continues to indicate a bullish trend. During the last reporting week, the number of longs for the "Non-commercial" group decreased by 300, while the number of shorts increased by 20,000. Consequently, the net position decreased by 20,300 contracts over the week.

On the hourly timeframe, the EUR/USD pair remains in a downward trend amid geopolitical events in the Middle East. The situation in the Middle East gave traders hope earlier in the week, but it has once again reverted to the realities of war and mutual threats. The dollar has not yet updated its annual highs, but given these developments, it may do so soon.
For March 12, we highlight the following trading levels: 1.1362, 1.1426, 1.1542, 1.1615-1.1625, 1.1657-1.1666, 1.1750-1.1760, 1.1830-1.1837, 1.1907-1.1922, 1.1971-1.1988, as well as the Senkou Span B line (1.1683) and the Kijun-sen line (1.1586). The lines of the Ichimoku indicator may shift during the day, which should be taken into account when determining trading signals. Don't forget to set a Stop Loss at breakeven if the price moves in the correct direction by 15 pips. This will protect against potential losses should the signal prove false.
On Friday, there are no significant reports or events scheduled in the European Union or the U.S., so movements in the pair today will once again depend on geopolitics.
On Friday, traders may consider short positions if the price consolidates below 1.1542, targeting 1.1426. Long positions can be considered if there is a rebound from the 1.1542 level, with targets at 1.1615-1.1625 and 1.1657-1.1666.


