
یہ بھی دیکھیں


 06.07.2026 10:59 AM
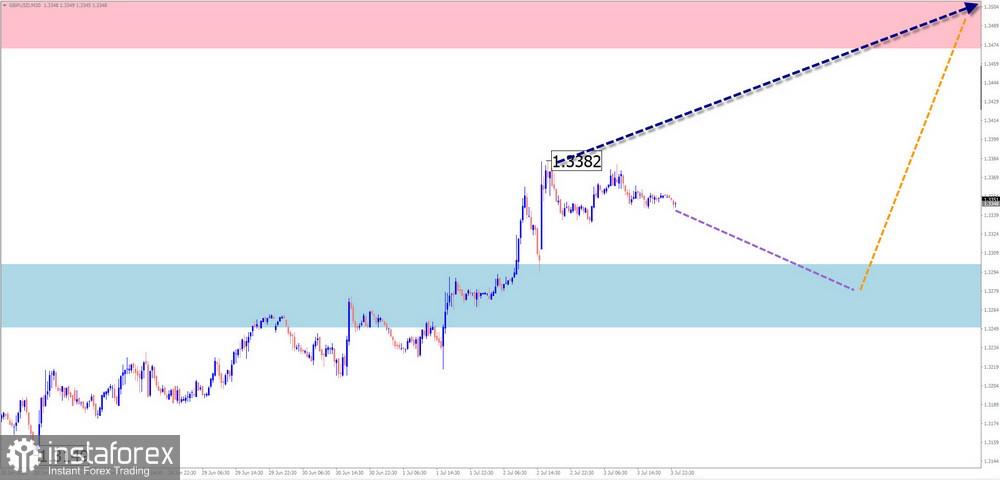
The downward wave on the British pound's primary currency pair, which has been developing since the beginning of this year, continues to determine the major's overall direction. Over the past three weeks, the pair has been forming a countertrend correction from the upper boundary of a strong potential reversal zone. At this stage, the wave structure does not yet appear to be complete.
During the coming week, the GBP/USD pair is expected to complete its current upward move. In the first few days, a short-term decline toward the support zone cannot be ruled out. After that, a reversal and renewed growth are expected. The resistance zone marks the projected upper boundary of the pair's weekly trading range.
Potential Reversal Zones
Resistance:
Support:
Trading Recommendations
Short positions: Upward potential for selling is limited. Reducing position size is advisable.
Long positions: It is safer to wait until confirmed bullish reversal signals appear near the support zone before entering the market.
AUD/USD
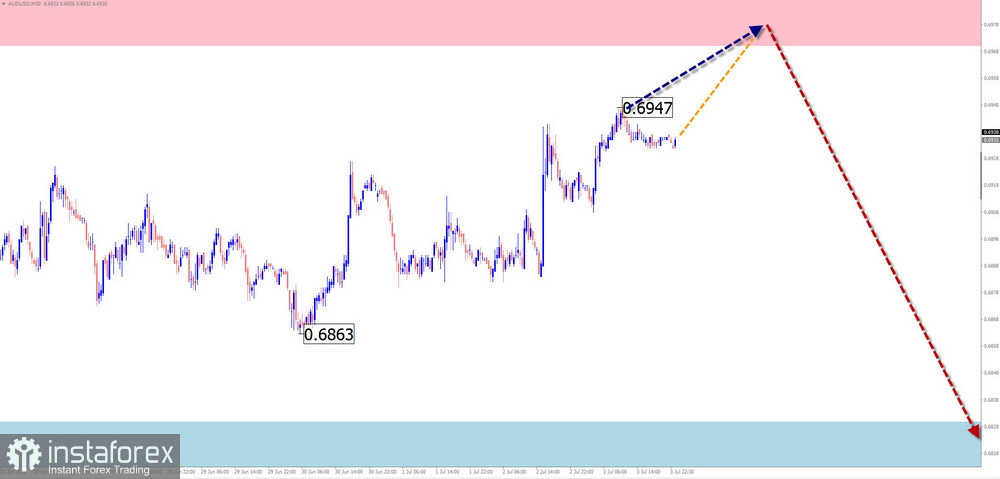
The current downward wave in the Australian dollar, which began on May 6, remains incomplete. Over the past four weeks, a hidden irregular correction (wave B) has been developing within its structure. At the time of analysis, the pair is approaching the lower boundary of a potential reversal zone.
In the coming days, the pair is expected to complete its sideways movement with a bullish bias. A reversal is likely to form within the projected resistance zone, followed by the resumption of the broader bearish trend. The downward potential is limited by the projected support zone. This support also coincides with the expected completion area of the current wave and aligns with the upper boundary of the daily-chart potential reversal zone.
Potential Reversal Zones
Resistance:
Support:
Trading Recommendations
Long positions: Carry a high level of risk and may result in losses.
Short positions: May be considered after confirmed reversal signals emerge. A reduced position size is recommended.
USD/CHF
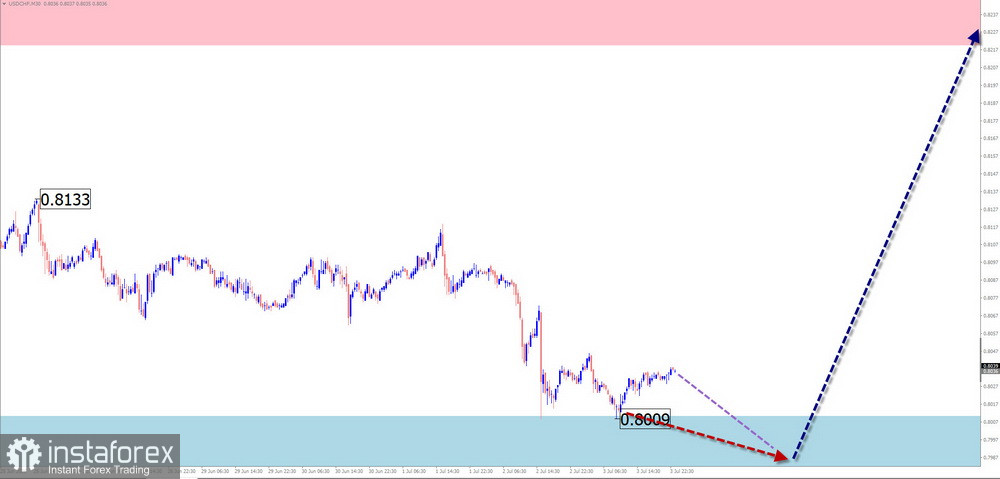
The six-month rally in USD/CHF resulted in a breakout above the hourly-chart potential reversal zone. Since the beginning of July, the pair has been correcting lower, forming the corrective phase of the latest bullish wave that started on May 11. The projected resistance coincides with the lower boundary of the next potential reversal zone.
At the beginning of the coming week, the current downward move is expected to be completed. A bullish reversal and the resumption of the upward trend are likely near the support zone. The strongest market activity is expected toward the end of the week.
Potential Reversal Zones
Resistance:
Support:
Trading Recommendations
Short positions: Offer little potential and remain risky.
Long positions: Short-term buying opportunities may emerge after confirmed reversal signals appear near the support zone.
EUR/JPY
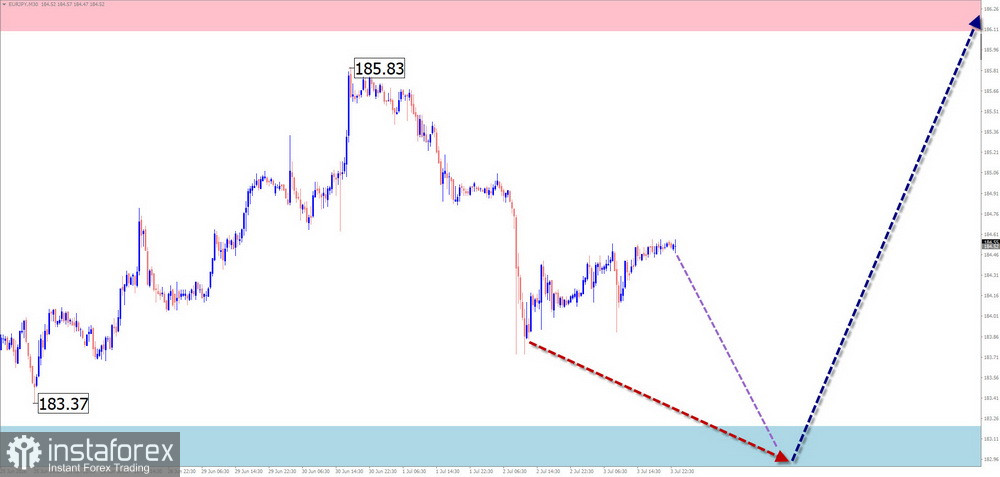
On the EUR/JPY chart, the short-term trend continues to be driven by a broader bullish wave. Its unfinished segment has been moving downward since the end of June. The pair remains trapped in a narrow trading range between potential reversal zones of different scales.
The pair is expected to continue declining next week until the downward phase is completed near the support zone. A sideways market is more likely during the first couple of days. Afterward, a reversal and a move toward the resistance zone are expected. Volatility is likely to increase toward the end of the week.
Potential Reversal Zones
Resistance:
Support:
Trading Recommendations
Short positions: May be considered with reduced position sizes during individual trading sessions.
Long positions: Carry a high level of risk until confirmed bullish reversal signals are generated by your trading system.
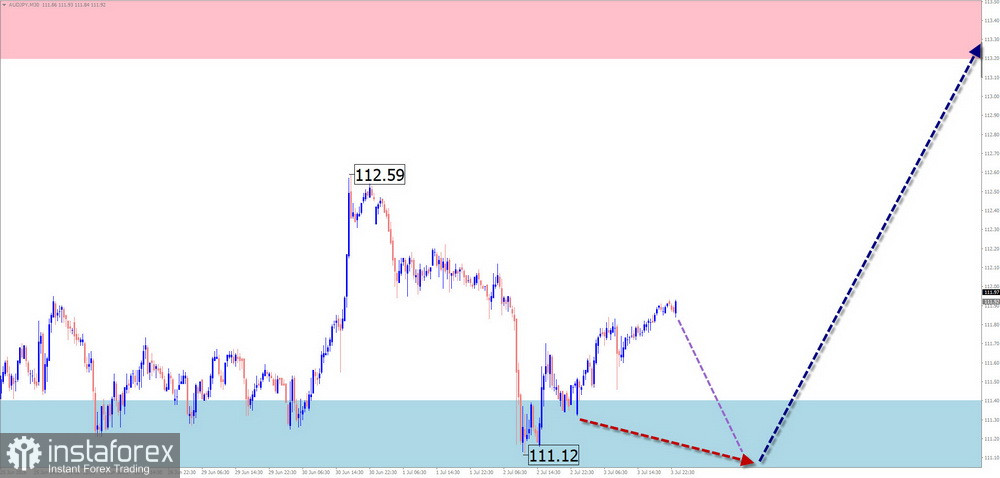
AUD/JPY
Since November of last year, price action in AUD/JPY has been governed by a downward corrective pattern. Trendlines drawn through recent price extremes form a horizontal pennant pattern. Wave analysis indicates that the final stage of this structure has been developing since April.
Throughout the coming week, the pair is expected to trade along the support zone. Temporary pressure and a brief break below the lower boundary of the support zone cannot be ruled out. Volatility is likely to increase during the second half of the week. By the end of the week, the probability of a trend reversal will increase.
Potential Reversal Zones
Resistance:
Support:
Trading Recommendations
Short positions: May be considered on an intraday basis using reduced position sizes.
Long positions: Premature until confirmed bullish reversal signals appear near the support zone.
EUR/GBP
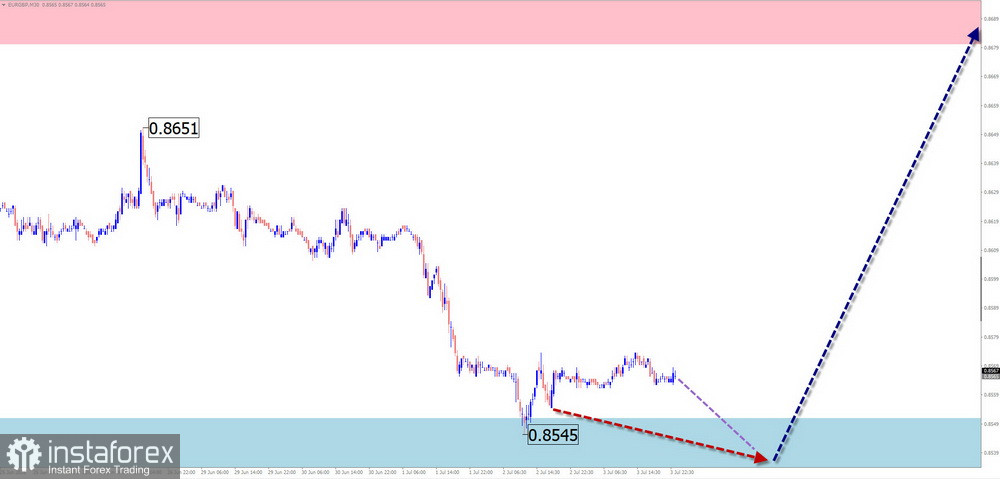
The unfinished wave in EUR/GBP remains directed downward. At the time of analysis, the pair has reached the upper boundary of the hourly-chart potential reversal zone. The wave structure has become increasingly due for a corrective move. However, there are currently no signs of an imminent reversal.
At the beginning of the coming week, a short-term decline toward the support zone is expected. Afterward, the probability of a reversal and the beginning of an upward move will increase. The projected resistance zone marks the upper boundary of the pair's expected weekly range.
Potential Reversal Zones
Resistance:
Support:
Trading Recommendations
Short positions: Offer limited potential and involve elevated risk.
Long positions: May be considered only after confirmed reversal signals appear near the support zone.
Explanation: In Simplified Wave Analysis (SWA), every wave consists of three segments (A–B–C). On each timeframe, the analysis focuses on the latest incomplete wave. Dashed lines indicate the expected price movement.
Note: The wave algorithm does not take into account the time duration of price movements.


