Vea también

 18.11.2025 11:17 AM
Trend Analysis (Fig. 1).
On Tuesday, the market, from the level of 1.1590 (yesterday's daily candle close), may continue moving downward toward the target of 1.1556 – a historical support level (blue dashed line). When testing this level, the price may possibly retrace upward to test the 23.6% retracement level at 1.1574 (yellow thin line).
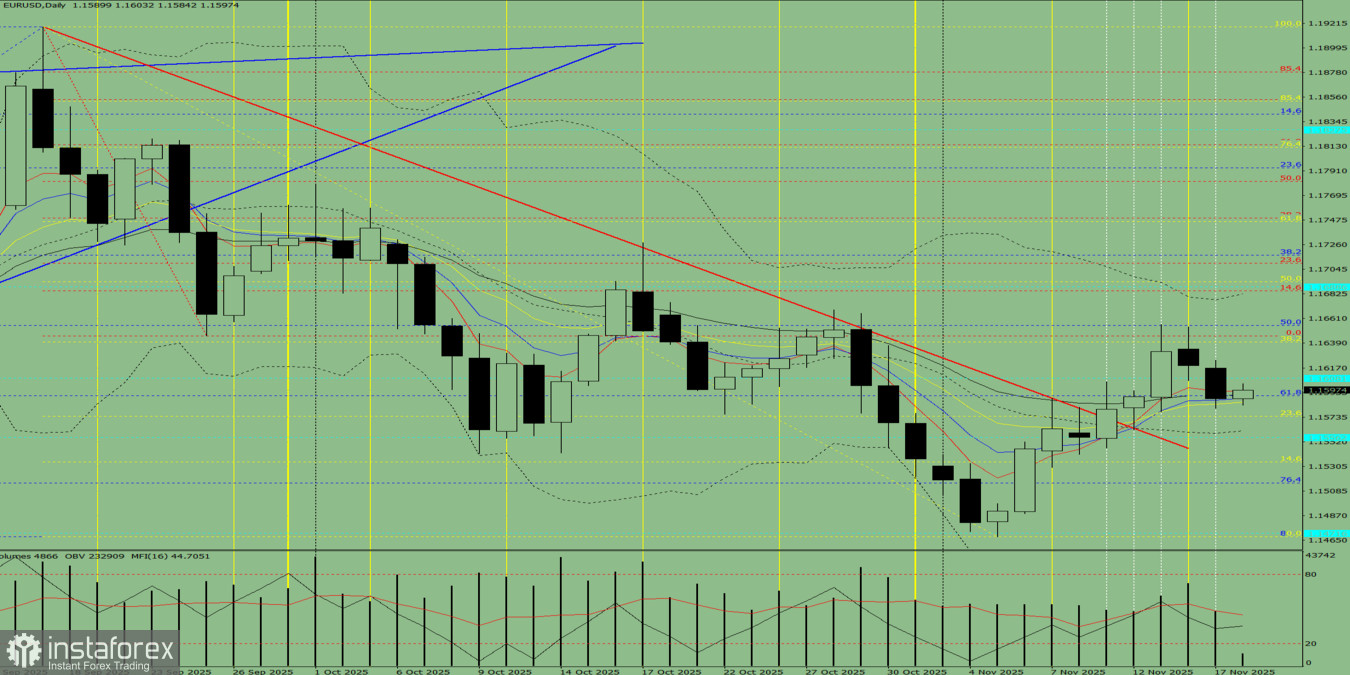
Fig. 1 (daily chart).
Comprehensive Analysis:
Overall conclusion: downward trend.
Alternative scenario: From the level of 1.1590 (yesterday's daily candle close), the price may begin a downward movement toward 1.1534 – the 14.6% retracement level (yellow dashed line). When testing this level, the price may possibly retrace upward toward 1.1556 – the historical support level (blue dashed line).
You have already liked this post today
*El análisis de mercado publicado aquí tiene la finalidad de incrementar su conocimiento, más no darle instrucciones para realizar una operación.


