Vea también

 15.04.2026 10:35 AM
Bitcoin has been tracing a sort of upward move that is merely a correction for two months. This is clearly visible on the daily timeframe. The liquidity pool below remains untouched, and the price is likely to revisit it with about a 90% probability. We believe market-maker manipulations are possible in the near term to convince traders that an uptrend has begun.
Meanwhile, Michael Saylor's company Strategy invested another $1 billion in Bitcoin. Although all investments in "digital gold" are currently loss?making, the company continues to pour all available cash into BTC. In our view, Strategy has become hostage to Bitcoin. Just imagine that the company has put tens of billions of dollars into Bitcoin, effectively making it the core of its investment strategy. Now, if Strategy starts selling "digital gold," it would crash the price, since the company holds roughly 800,000 coins on its balance sheet, making it one of the industry's key players. If Strategy stops buying, a bearish trend could continue, and losses would deepen. In effect, Strategy is trying to create momentum for Bitcoin and convince the market that a rally is inevitable. Time will tell whether this idea comes true. The deal was financed by selling preferred shares.
As we can see, Strategy's approach hasn't helped Bitcoin much so far. Despite data on ETF inflows, Bitcoin shows no appetite to start a new uptrend. That means inflows are too small or concurrent outflows are too large. Either way, we still see no solid reasons to expect an uptrend from current levels.
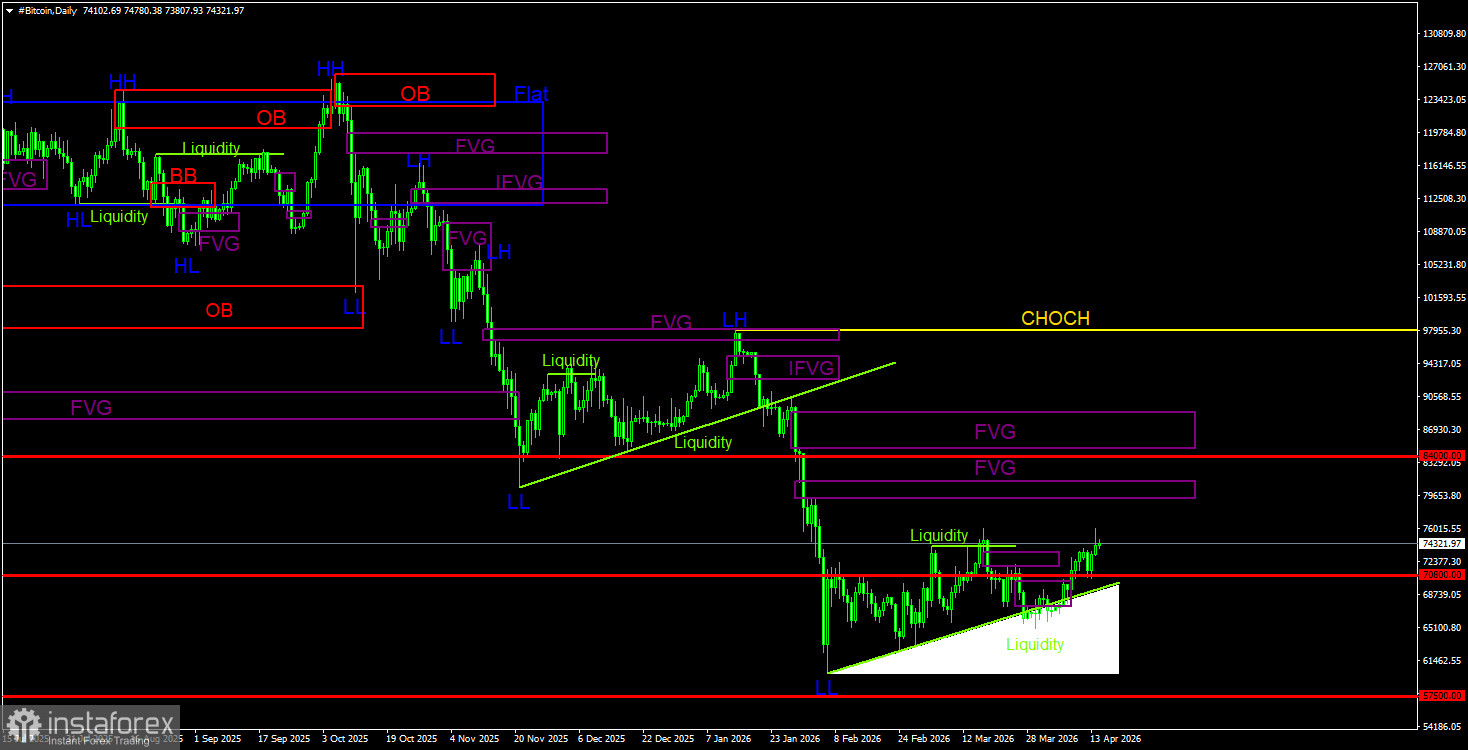
Bitcoin continues to form a full bearish trend with corrective rallies against it. We still expect a decline toward $57,500 (the 61.8% Fibonacci level of the three-year uptrend), and there are currently no signs of a trend reversal. Even $57,500 no longer looks like a final stop. From current POI areas, only the nearest bearish FVG on the daily TF — around $79,300–$81,200 — stands out. On the 4-hour TF, Bitcoin has swept liquidity, but that alone is insufficient to open shorts; bearish patterns are needed. Although sometimes a liquidity sweep is enough to trigger a serious move.
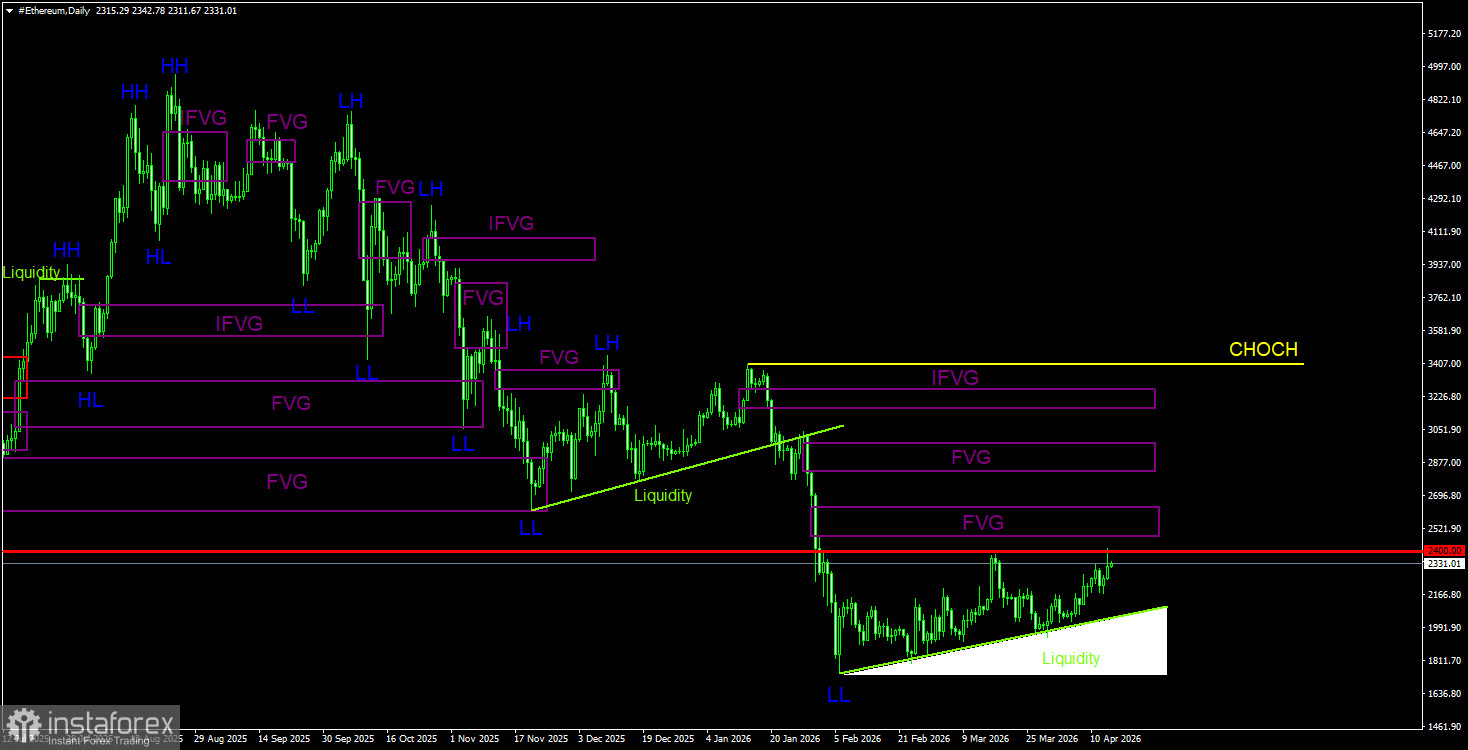
On the daily TF, a downtrend is still in progress, with corrective moves against it. The key sell pattern was and remains the bearish order block on the weekly TF. As we warned, the move triggered by that signal can be strong and prolonged. After it formed, Ether fell about 55% (roughly $2,500). In the near term, Ethereum may continue a weak upward correction, but every correction ends sooner or later. On the 4-hour TF, Ethereum has worked through the recent FVGs fairly well, but price action remains weak and corrective. Bitcoin and Ethereum have swept liquidity from the March 17 highs. A decline could begin in the near future.
CHOCH — change of character / break of the trend structure. Liquidity — liquidity, traders' Stop?Losses that market?makers use to build their positions. FVG — Fair Value Gap (area of price inefficiency). The price often moves quickly through such areas, indicating the absence of one side in the market. Later, the price tends to return and react to these zones. IFVG — Inverted Fair Value Gap. After a return to such a zone, the price does not react but impulsively breaks through and then tests it from the other side.
OB — Order Block. A candle on which a market?maker opened a position in order to harvest liquidity and then form their own position in the opposite direction.


