আরও দেখুন

 21.10.2025 09:53 AM
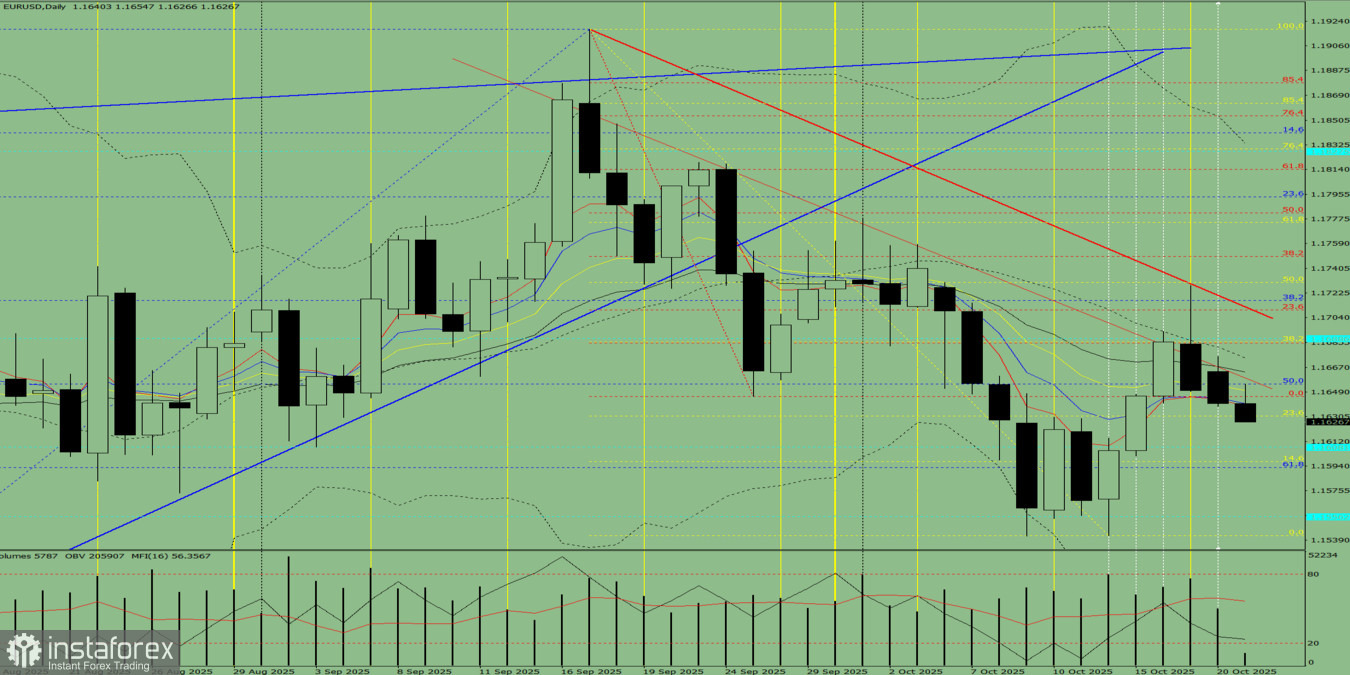
Fig. 1 (Daily Chart)
Comprehensive Analysis:
Overall conclusion: Downward trend.
Alternative scenario: From the 1.1640 level (yesterday's daily candle close), the price may continue moving downward toward 1.1608 – a historical support level (blue dashed line). Upon testing this level, the price may possibly rebound upward toward 1.1631 – the 23.6% retracement level (yellow dashed line).
You have already liked this post today
*এখানে পোস্ট করা মার্কেট বিশ্লেষণ আপনার সচেতনতা বৃদ্ধির জন্য প্রদান করা হয়, ট্রেড করার নির্দেশনা প্রদানের জন্য প্রদান করা হয় না।


