यह भी देखें

 21.10.2025 09:53 AM
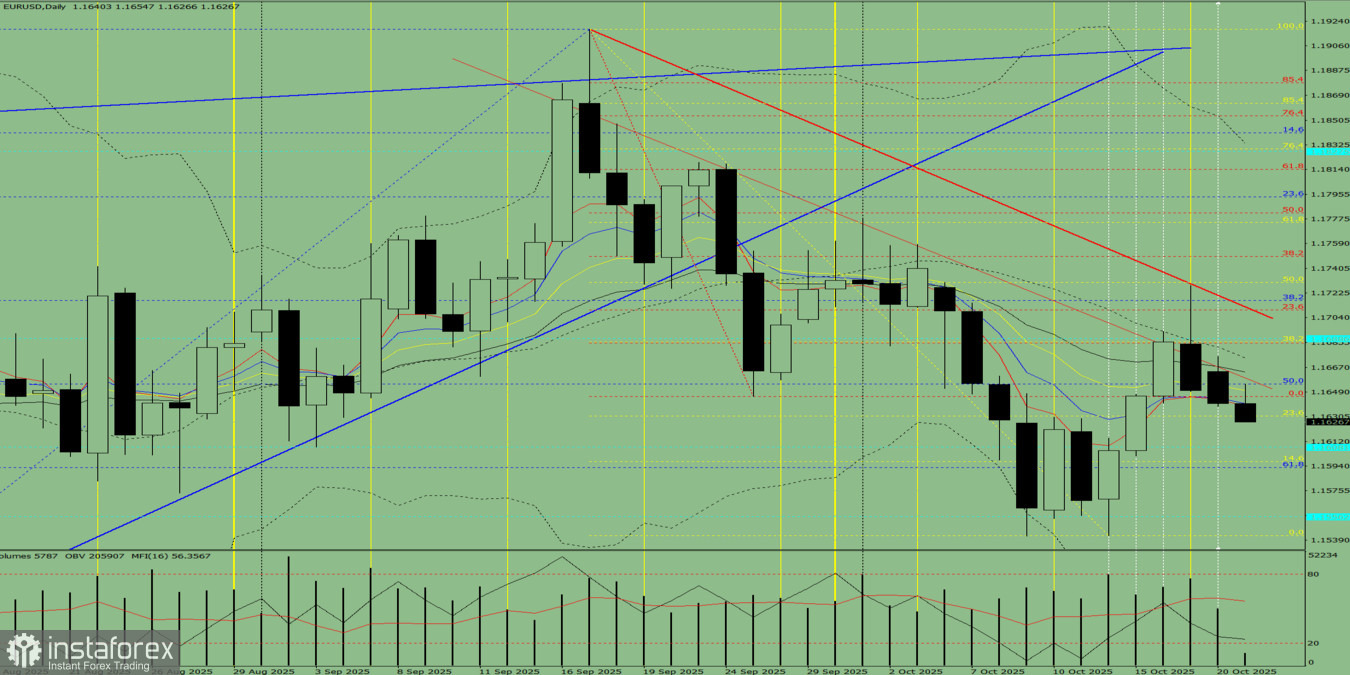
Fig. 1 (Daily Chart)
Comprehensive Analysis:
Overall conclusion: Downward trend.
Alternative scenario: From the 1.1640 level (yesterday's daily candle close), the price may continue moving downward toward 1.1608 – a historical support level (blue dashed line). Upon testing this level, the price may possibly rebound upward toward 1.1631 – the 23.6% retracement level (yellow dashed line).
You have already liked this post today
*यहां पर लिखा गया बाजार विश्लेषण आपकी जागरूकता बढ़ाने के लिए किया है, लेकिन व्यापार करने के लिए निर्देश देने के लिए नहीं |

