
Veja também


 06.07.2026 10:59 AM
Analysis of the euro's primary currency pair indicates that the latest bearish wave structure, which began at the end of January this year, remains incomplete. In its final segment (C), after breaking below a major support level, the pair has spent the past two weeks consolidating below it while forming an intermediate correction. At the time of writing, the corrective structure appears complete, although there are still no confirmed signals of an imminent reversal.
During the coming week, the euro is expected to continue trading within a broadly sideways range. An upward bias is more likely during the first few days, with the price potentially testing the upper boundary of the resistance zone. A reversal and the beginning of a downward move are expected closer to the weekend.
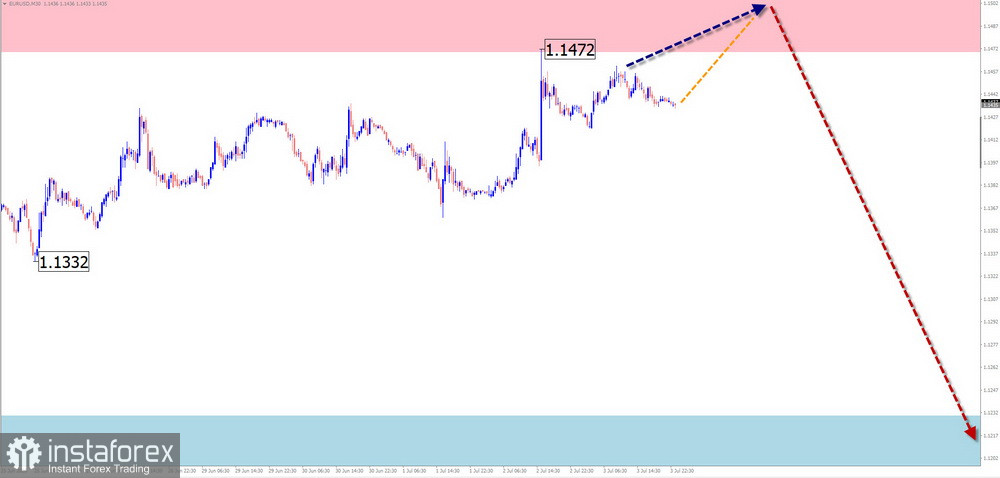
Potential Reversal Zones
Resistance:
Support:
Trading Recommendations
Short positions: Premature until confirmed reversal signals emerge near the resistance zone.
Long positions: May be considered with reduced position sizes during individual trading sessions. Upward potential is limited by the resistance zone.
USD/JPY
The short-term direction of USD/JPY continues to be determined by the bullish wave that began on April 30. In recent weeks, the pair has been forming the middle segment (B) as an extended flat correction, which remains incomplete at the time of analysis. The pair is currently trading near the lower boundary of a major potential reversal zone on the higher timeframe.
The downward move is expected to continue over the coming days, with the pair declining toward the support zone. Afterward, the market is likely to shift into a sideways phase. A reversal and the resumption of the broader upward trend may occur toward the end of this week or at the beginning of next week.
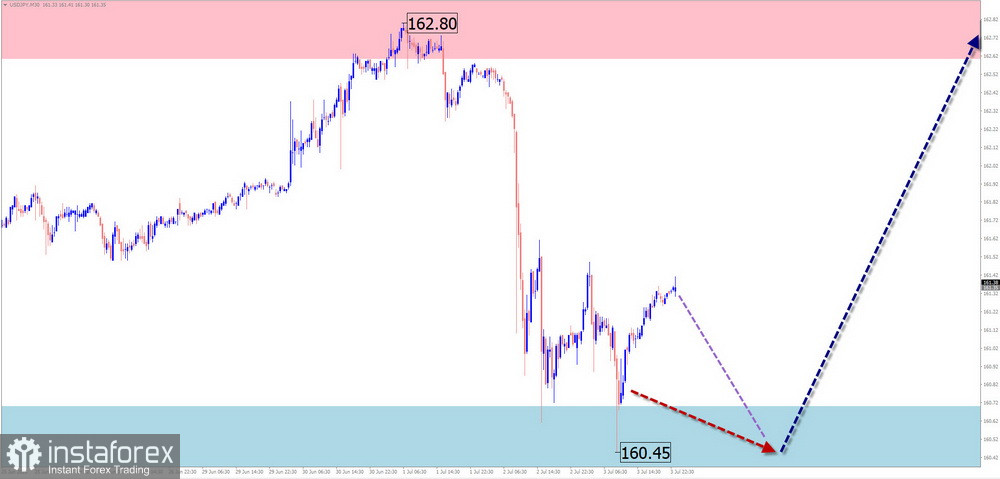
Potential Reversal Zones
Resistance:
Support:
Trading Recommendations
Short positions: May be considered with reduced position sizes during individual trading sessions. Downward potential is limited by the support zone.
Long positions: Premature until confirmed bullish reversal signals appear near the support zone according to your trading system.
GBP/JPY
Price action in GBP/JPY has been driven by a bullish wave for several months. On the higher timeframe, this wave is entering a new segment in the direction of the dominant trend. At the time of analysis, the pair is trading near the lower boundary of a higher-timeframe potential reversal zone. The wave structure suggests that a corrective pullback is due.
The pair is expected to maintain its overall upward movement at the beginning of the week. Once this phase is complete near the projected resistance zone, a reversal and a downward move are expected. The highest volatility is likely toward the end of the week.
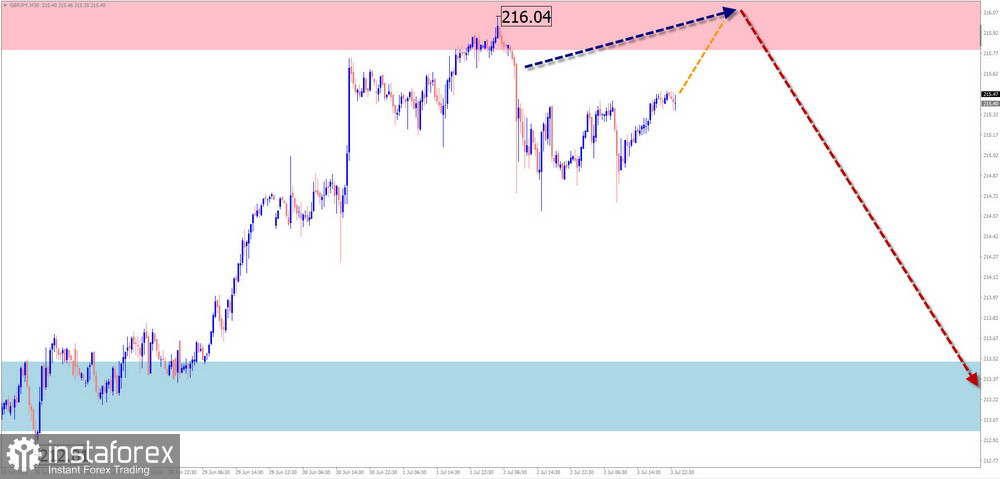
Potential Reversal Zones
Resistance:
Support:
Trading Recommendations
Long positions: Offer limited potential.
Short positions: May be considered after confirmed reversal signals appear on the chart.
USD/CAD
Price fluctuations in USD/CAD continue to follow the dominant bullish wave that has been in place over the past six months. The current unfinished impulsive segment began on May 1. During the past two weeks, the pair has been forming its middle segment (B). The price is currently located near the upper boundary of the hourly-chart potential reversal zone.
During the next couple of days, the pair is expected to continue moving sideways with a bearish bias, creating conditions for a reversal. In the second half of the week, volatility is expected to increase, followed by a bullish reversal and the resumption of the upward trend.
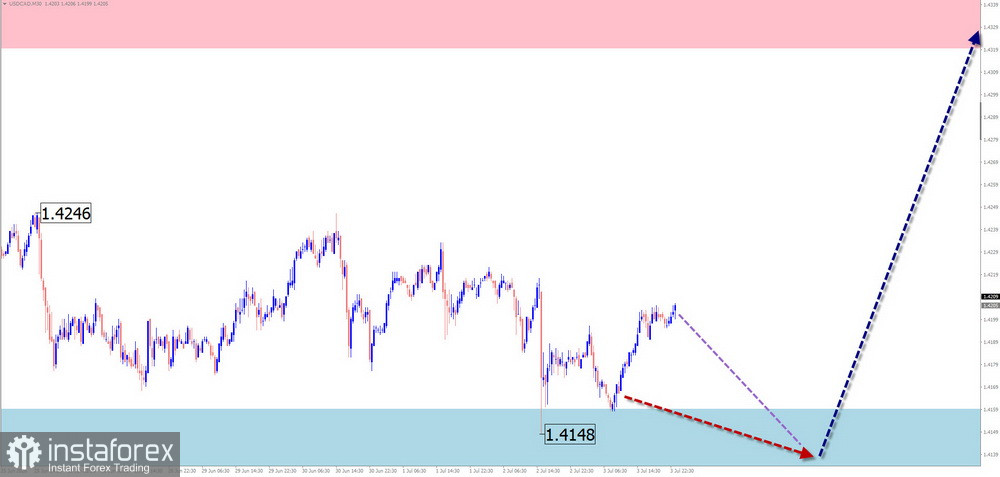
Potential Reversal Zones
Resistance:
Support:
Trading Recommendations
Short positions: Current market conditions do not favor selling.
Long positions: May become the preferred strategy after confirmed bullish reversal signals appear near the support zone.
NZD/USD
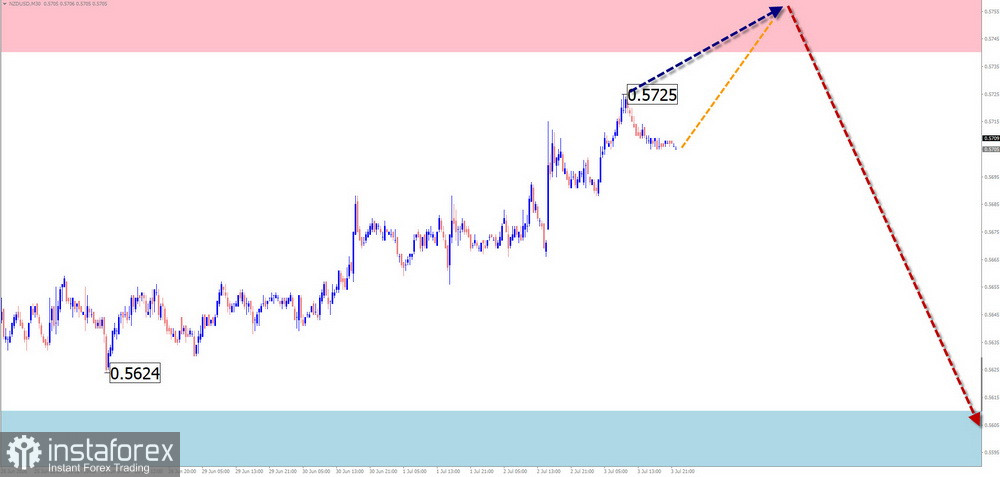
Since the end of April, the overall direction of NZD/USD has been determined by a bearish wave. After the correction that ended on May 29, a new downward segment of the main trend began. At the time of analysis, the pair is undergoing an intermediate corrective pullback.
At the beginning of the coming week, the pair is likely to continue moving higher toward the resistance zone. Afterward, a reversal and the resumption of the broader downward trend are expected. During the reversal, a temporary breakout above the upper boundary of the reversal zone cannot be ruled out. Volatility is expected to increase toward the end of the week.
Potential Reversal Zones
Resistance:
Support:
Trading Recommendations
Long positions: Have limited upward potential. Reduced position sizes are recommended.
Short positions: Will become relevant after confirmed reversal signals appear near the resistance zone.
Gold
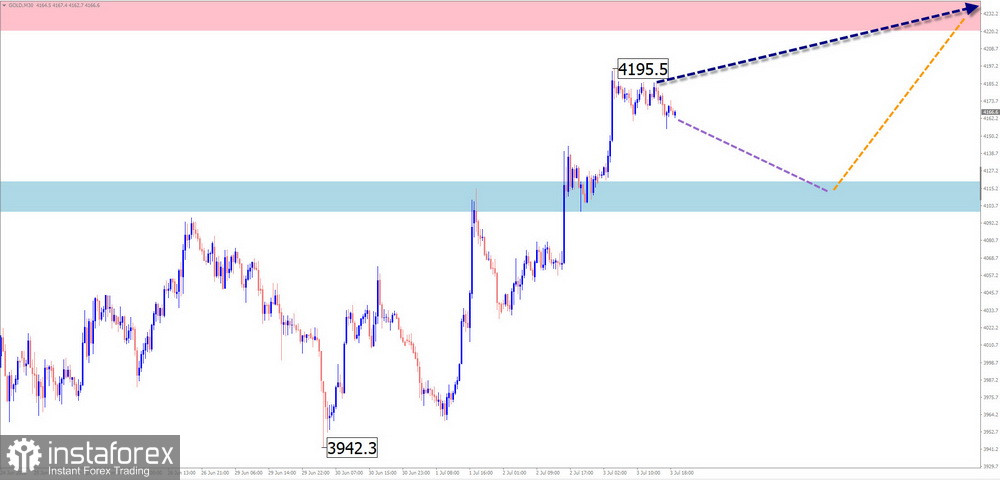
Gold prices continue to develop the corrective phase of the instrument's broader uptrend that began in April. On the chart, the correction is taking the form of a descending pennant. At the time of analysis, this wave remains incomplete. The projected resistance corresponds to the upper boundary of the price channel that has formed over recent months.
Gold prices are expected to continue rising throughout the coming week. A pause and the formation of reversal conditions are likely near the resistance zone. Closer to the weekend, the probability of a downward move in gold prices will increase.
Potential Reversal Zones
Resistance:
Support:
Trading Recommendations
Long positions: May be considered with reduced position sizes during individual trading sessions.
Short positions: Premature until confirmed reversal signals appear near the resistance zone.
Explanation: In Simplified Wave Analysis (SWA), every wave consists of three segments (A–B–C). On each timeframe, the analysis focuses on the latest incomplete wave. Dashed lines indicate the expected direction of price movement.
Note: The wave algorithm does not take into account the duration of price movements over time.


