
Veja também


 27.07.2026 04:28 AM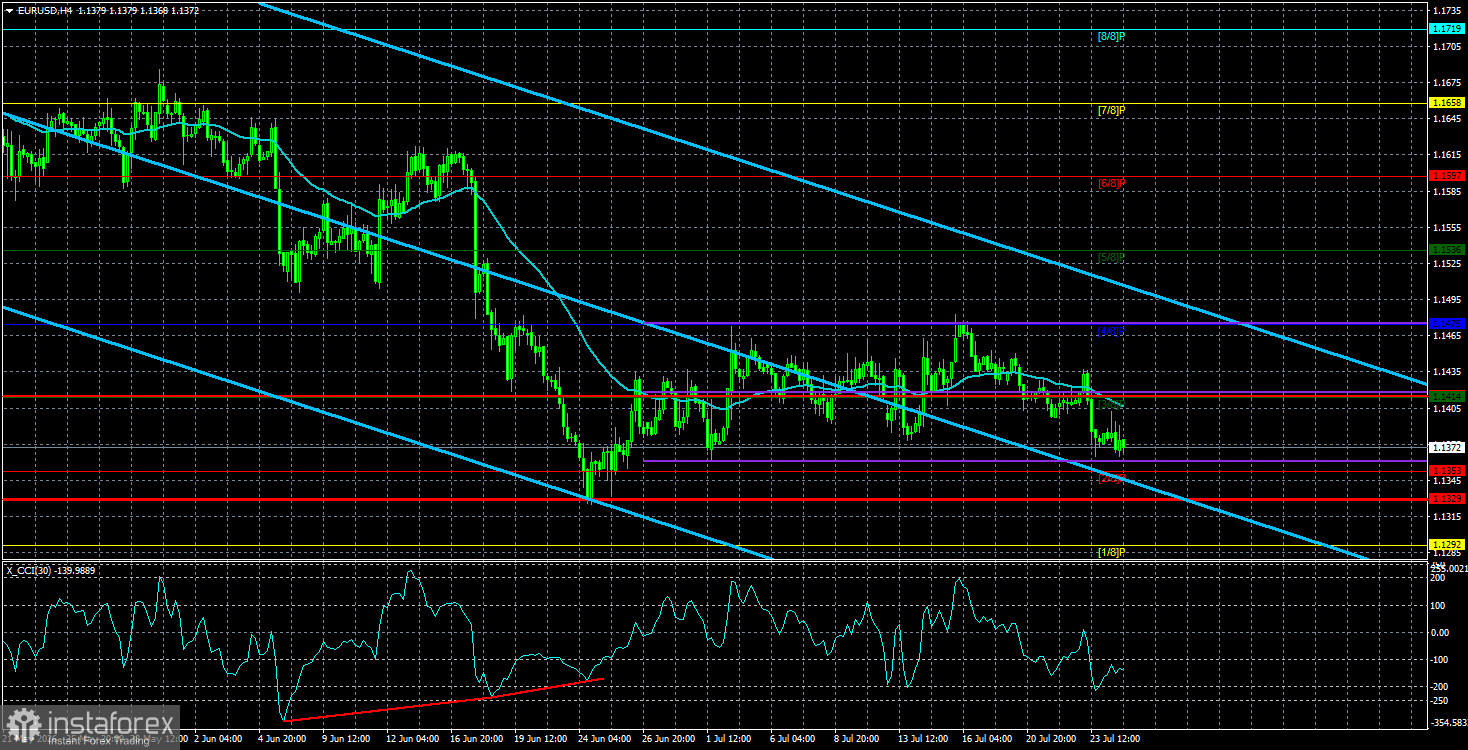
The EUR/USD pair once again demonstrated ultra-low volatility on Friday, and last week the pair moved only on Thursday, when the results of the European Central Bank meeting were disclosed in the European Union. In essence, these results proved to be somewhat "neutral," albeit with a "hawkish" tilt. Due to total uncertainty surrounding the geopolitical conflict in the Middle East, the situation around the Strait of Hormuz, future oil prices, and inflation levels, the ECB decided not to change interest rates in July. However, it clearly indicated that a hawkish decision could be made at any moment as circumstances require.
Thus, the ECB maintains a hawkish stance but is reluctant to rush. Meanwhile, the market continues to ignore the ECB's hawkish outlook. A month and a half ago, it paid no attention to the first tightening of monetary policy in the eurozone in a long time, and last week it overlooked the maintenance of that hawkish stance. It should also be noted that in this case, it cannot be said that market expectations did not align with reality. No one expected the ECB to tighten in July, and it did not happen. As for prospects, everyone understands that if inflation rises, the ECB will raise rates, as it has confirmed its readiness for tightening several times. And inflation will rise if the conflict in the Middle East continues to escalate with new intensity.
Consequently, the euro continues its seemingly illogical decline while the dollar exhibits nonsensical growth. Some might argue that the geopolitical conflict in the Middle East has resumed and is a significant reason for the dollar's continued rise. However, why did the dollar not decline at all after June 17 when the US and Iran signed a memorandum of understanding? At the same time, the Federal Reserve hinted at tightening monetary policy in 2026. Thus, the dollar continued to rise? It seems quite convenient. It results in the dollar simply selecting favorable factors for further growth while ignoring others. This way of reasoning could explain virtually any movement.
We believe that the euro did not deserve to fall after June 17. The Fed has not even started raising key rates, yet the market has been buying dollars for over a month. Meanwhile, it ignores the ECB's tightening. And what if Donald Trump and Iran manage to reach a real deal, the Strait of Hormuz is opened, oil prices return to pre-war levels, and inflation in the US continues to decelerate? In that case, the Fed will not conduct tightening that the market has already priced in. If, of course, it does. We think that the current decline in the pair is a manipulation aimed at convincing traders that the dollar will only become more expensive. To reiterate, there are no logical explanations for the current rise of the dollar.
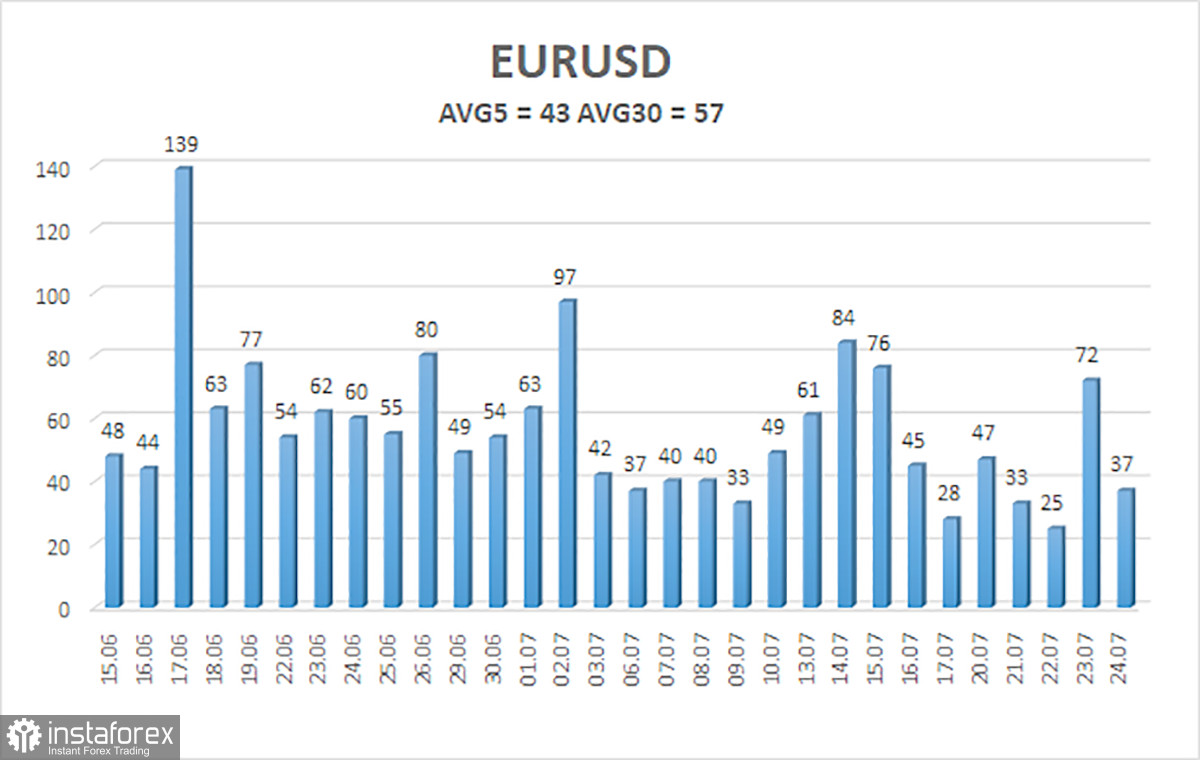
The average volatility of the EUR/USD pair over the last five trading days as of July 27 is 43 pips and is characterized as "low." We expect the pair to move between levels 1.1329 and 1.1415 on Monday. The upper linear regression channel is directed downward, indicating a continuation of the downtrend. The CCI indicator has entered the oversold area and formed two bullish divergences, which warn of a possible end to the downward trend.
S1 – 1.1353
S2 – 1.1292
S3 – 1.1230
R1 – 1.1414
R2 – 1.1475
R3 – 1.1536
The EUR/USD pair continues its downward trend, which is presumably a correction within the framework of a global uptrend, as can be clearly observed on the daily or weekly timeframe. The global fundamental backdrop for the dollar remains negative, but in 2026, first geopolitics and then the Fed's hawkish stance have provided solid support for the American currency. When the price is below the moving average, short positions can be considered with targets of 1.1353 and 1.1329. Above the moving average line, long positions with targets of 1.1475 and 1.1536 are relevant. The market has been in a flat for the fourth consecutive week.
Linear regression channels help identify the current trend. If both are directed in the same direction, the trend is currently strong;
The moving average line (settings 20,0, smoothed) defines the short-term trend and direction in which trading should currently be conducted;
Murray levels are target levels for movements and corrections;
Volatility levels (red lines) indicate the probable price channel within which the pair will operate in the next 24 hours based on current volatility indicators;
The CCI indicator — its entry into the oversold area (below -250) or the overbought area (above +250) means an impending trend reversal in the opposite direction.


